Today’s Best …

tehranrally061509.jpg

… News coverage : If you wonder why all the commotion about Twitter, it’s worth checking in on users’ “coverage” of the Iranian election aftermath at http://twitter.com/timeline/search?q=%23iranelection . We need some other word than coverage to describe this; coverage suggests something organized and controlled. What we’re getting from Tehran is chaotic, rumor-filled, repetitive and largely dependent on mainstream news sources. But it’s also immediate, passionate, and encyclopedic, and it brings all of us closer to the scene. The picture above is a case in point, shot and posted today by a Twitter user in Tehran. (The Washington Post’s Howard Kurtz has a column today on Twitter and how it’s shifting the way we use media.)

… News analysis: Why does the Iranian opposition denounce the election results. FiveThirtyEight.com breaks down the numbers and shows some striking anomalies in the results. (On Saturday, on the other hand, FiveThirtyEight shot down one purported piece of evidence that the result was rigged.)

Friday Night Ferry Again

ferry061209.jpg

Due to a variety of strange occurrences during our news day today,I didn’t make it out of KQED until 7:35, 50 minutes before the ferry sailed. I thought about walking to BART and relaxing. Instead, I hoofed it over Potrero Hill and across the south of Market neighborhood and made the boat by about two minutes. One of the crew watched me walk on board, where Thom and Kate awaited, and said, “He’s sweating bullets.” (He was right — I ran the last few blocks, and was well warmed up when I got to the dock.) About 10 days before the summer solstice, it was a beautiful twilight on the bay. Then again, most of them are no matter what time of year.  

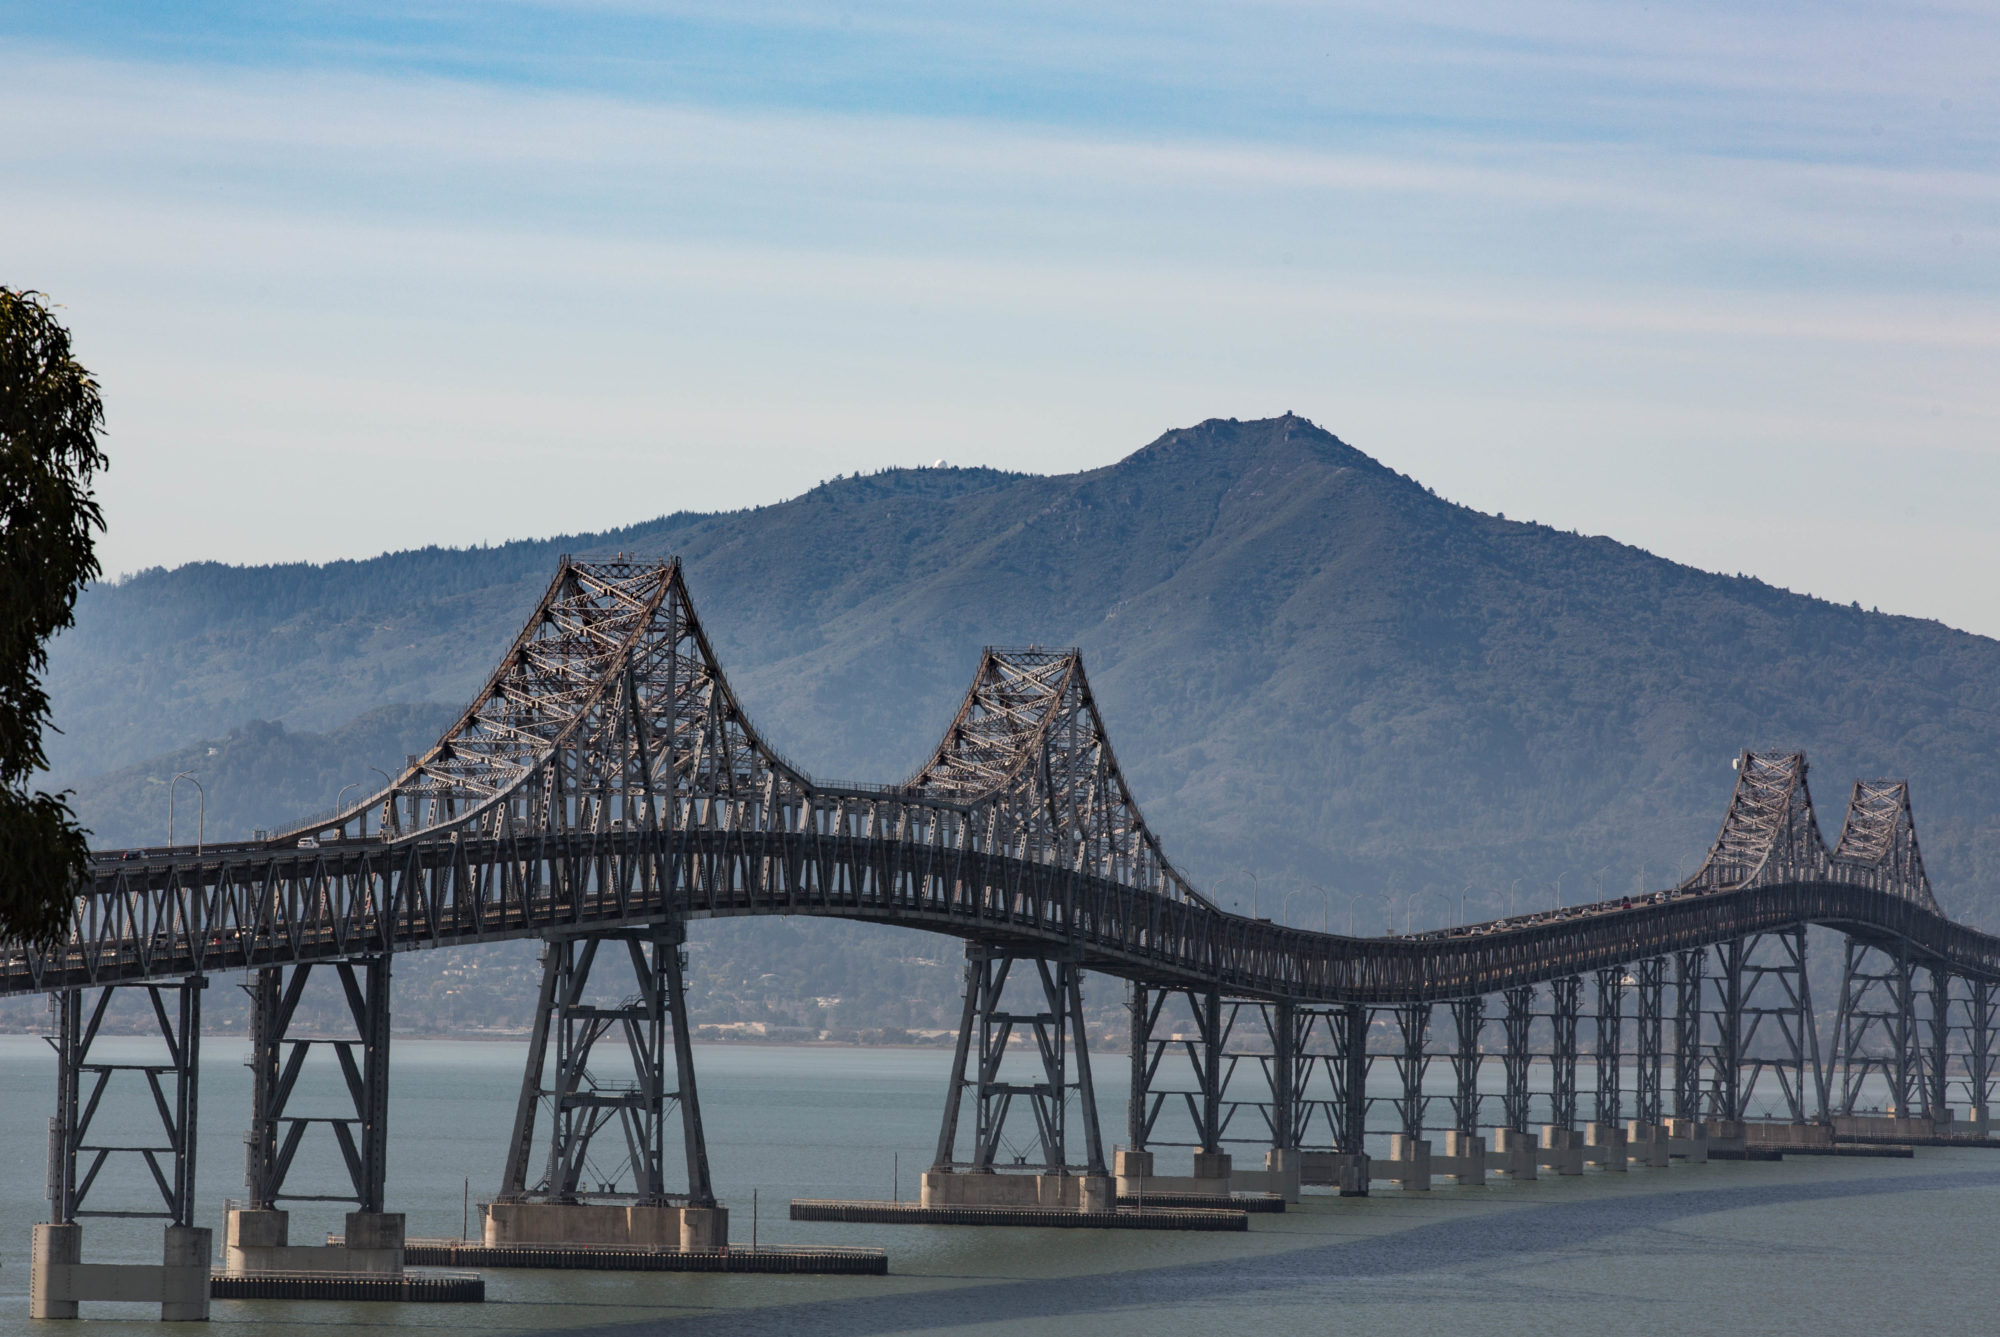
[If you’re keeping score of home, that’s downtown San Francisco, with the top of the Transamerica Pyramid, to the left; and in the right distance is Mount Tamalpais. Gorgeous, gorgeous night.]

Today’s Best …

… Headline: “Human Skill Found In Oakland Construction Site” (a Twitter message linking to this story).

… Sensory experience: 3:32 p.m.: We had an earthquake! Two short, sharp jolts that rattled the house hard and sounded like sonic booms or explosions (Kate just called from a neighborhood up in the hills, where she said people were out in the street, a little spooked by the shake). U.S. Geological Survey link to the temblor: http://bit.ly/10nSP4.

June Rain

junerain.jpg

Just after 10 o’clock tonight, the dog and I walked out the front door for a walk. He stopped on the porch and stared out at the street as if asking, “What’s that?” It was rain, an out-of-season occurrence. My tendency, confronted with weather that’s not supposed to happen at whatever time of year it’s happening, is to say, “This never happens.” Then I try to look it up.

So here’s a brief rundown on June rain in Berkeley, thanks to the Climate Summary and Monthly Total Precipitation tables at the Western Regional Climate Center.

–Years of record: 102 (1893 through 2008, with 16 missing).
–Berkeley mean June rainfall: 0.19 inches (annual mean: 23.45 inches).
–June maximum: 1.24 inches (1907). Other Junes with 1 inch or more: 1894, 1929, 1967, 1995, 2005.
–June minimum: 0.00 inches (38 times).

Five highest June rainfall totals:
June 15, 1929: 1.04 inches.
June 2, 1967: 0.88 inches.
June 8, 1964: 0.69 inches.
June 17, 1894: 0.63 inches.
June 11, 1907, and June 24, 1912: 0.61 inches.

Rain on the Roof

Who owns the water that falls on your rooftop? In most of the western United States, it’s not you, and if you try to catch and store that water, you may be interfering with someone else’s water rights. NPR aired a story on the issue this morning, “Water Wars Out West: Keep What You Catch,” about a Colorado law that breaks with the usual legal regime. The law allows water collection by residential property owners who need to dig a well or get their supply trucked in (in other words, if you’re served by what city dwellers think of as a regular water system, it’s still illegal for you to catch and save rainwater and snowmelt in Colorado.)

The links:

An Act: Concerning Limited Exemptions for Water Collected from Certain Residential Rooftops

Southwest Colorado Water Information Program: Understanding Water Rights

U.S. Bureau of Land Management: Western States Water Laws

NPR: “Water Wars Out West: Keep What You Catch!

And also, for generally interesting reading on water rights questions, Aguanomics, a blog from two UC-Berkeley economists.

Evaporation

When you read California’s daily water-storage reports and pore over the columns of data–for instance, from Lake Shasta, the state’s largest reservoir–you happen across this one: EVAP. It’s a record of how much water escapes the lake by changing state from liquid to gas. We’re schooled very early on in our science education about the hydrologic cycle. You know, the process by which water evaporates from oceans, lakes, rivers, and your scotch on the rocks, is transported into the atmosphere to fall as rain or snow, and then is evaporated and carried into the sky once more. Still, it’s one thing to know that a theoretical process is operating out there in the world somewhere and another to see its monumental workings in a statistical read-out.

Go back to Lake Shasta. I’ve been to the dam that holds it back, and I’ve driven past it dozens of times. It sprawls in an endless series of bays and inlets — old river courses — among the mountains that wall off the northern end of the Central Valley. The lake is usually ringed by a collar of brilliant orange-red soil, the upper margin of which marks the reservoir’s high-water mark. That ring is a sort of drought gauge: the more of it you see, the lower the lake is and, generally, the drier the state is.

One thing I don’t think when I drive past Shasta is that I’m watching a massive machine pumping millions of gallons of water into the sky. But that’s what it is. According to the summary from the Department of Water Resources California Data Exchange Center, yesterday the lake lost about 316 cubic feet of water per second through evaporation. Here’s what that is in household terms:

–A cubic foot of water is 7.48 gallons, so the lake was leaking 2,363.68 gallons into the atmosphere every second; three seconds’ worth at that rate would be more water than we’ve ever used in our Berkeley household in an entire month.

–Every minute, 141,820.8 gallons evaporated. In rough terms, the evaporation rate was 1 acre-foot every two minutes and 15 seconds. That’s a generous annual supply of water for two water-guzzling U.S. household.

–Every hour, 8,509,248 gallons of water — about 26.1 acre-feet — departed the lake. That’s enough to submerge a football field to a depth of 20 feet.

–For the day (and the evaporation rate is a 24-hour average), the lake lost 204,221,952 gallons, or 627 acre-feet. That’s a minor part of the reservoir’s net change for the day–the overall level fell by 7,271 acre-feet, mainly through water released for power generation–and it’s a tiny fraction of the lake’s current storage, about 3.15 million acre-feet.

Last stat for now: the process of evaporation is highly dependent on local weather, just like the grade-school lesson on the water cycle would suggest. When it’s warm, more water evaporates as the surface layer of lake water heats up. When it’s cool, the process slows. For the past month, the highest daily evaporation rate was 362 cubic feet per second, in the midst of a spike of very hot weather. The low point was 14 CFS, during a stretch of cool, rainy weather.

Wind and Water

aqueduct040508.jpg

From the archives: Last spring, Kate and I drove out to Bethany Reservoir, just south of the Sacramento-San Joaquin Delta at one of the key points in the state’s complex water system. The site is also on the lower eastern slopes of the Altamont Pass country, a big wind-generation site. Pondering the state’s water story and how to tell it–do you take the narrative back to Genesis and/or The Big Bang and talk about where water itself comes from, and how long would it take from that point to get to a discussion of a salmon in the river?– I thought of that visit tonight. Here’s a shot of a wind farm virtually on the bank of the Delta-Mendota Canal–part of the federally developed Central Valley Project–just southeast of Bethany. Whatever you happen to think of the way the water systems were built here and the damage they have caused to salmon and other parts of the old California environment–the engineering is never less than impressive and sometimes beautiful.

The aqueducts move water through a combination of gentle flow and brute force: huge quantities of water are lifted from pumping stations to artificial lakes like Bethany. Then gravity takes over, and the water flows down the manmade rivers to the next set of pumps, maybe 60 or 100 miles away, and the process is repeated. (One of the more surreal sights in the state is along Interstate 5 as the highway climbs the Tehachapi Mountains. The aqueduct runs along the highway, and the water is pumped up nearly 2,000 feet through a pair of above-ground tunnels.) One beauty in the aqueducts is the way they follow the contours along the border of the Coast Range hills to the west and the great valley to the east. The engineers had to work with and respect the lay of the land here.

(Here’s the satellite view, with the hills in their full-on golden summer hue. The image shows Bethany Reservoir. The water comes in from a channel at the northwest corner, having been pumped out of the Sacramento River to a holding basin called Clifton Court Forebay. The California Aqueduct flows out to the south and east (below and to the right). Drag the map to follow the course of the aqueduct. In this image, the California Aqueduct is on the left and the Delta-Mendota Canal is to the right.)


View Larger Map

Special Election

As you Californians know, and as you non-Golden Staters may have heard, we have a statewide special election today. “Special election” is a misnomer of sorts, since we’re deciding not on any candidate but on a series of ballot initiatives that putatively address the state’s fiscal crisis. The state’s finances are in a royal mess thanks largely to the housing bust. The budget process has been subjected to a galaxy of special conditions thanks to decades of initiatives and ballot-box constitutional amendments. So the Legislature and governor are reduced to, and have let themselves be reduced to, the role of managers of the voters’ contrary and self-contradictory whims.

Expression of these whims may seem like a form of democracy. But it’s a twisted and extremely limited form of democratic expression. The simple arithmetic of our electoral process — about two-thirds of eligible voters register, and about two-thirds of the registered voters go to the polls in a good year, and decisions are usually rendered by a simple majority of those who cast ballots — guarantees a form of minority rule. And it’s a minority with an identifiable character: the active electorate tends to be older, whiter, more affluent, and more conservative than the population in general. Today’s vote will be even more skewed than usual. The guesses out there are that just 25 percent of registered voters will go to the polls. That means that the agreement of just one-eighth of those registered, and less than one-tenth of those eligible, will be enough to set state policy for years to come.

Not that I blame voters entirely. The propositions before them are singularly unattractive. The people are confronted with a palette of taxes, theoretical spending limits, special set-asides for education, and changes in the operation of the California lottery. They’ve been told that whatever the outcome, the state is about to undergo another round of deep budget cuts. To vote yes on most of these initiatives is to opt into a dim future; to vote no is to invite a dreadful one. The only measure people seem to really comprehend and support is one that will prevent state officials from taking a pay raise when the state is running a deficit.

California is one of those enterprises that is too big to let fail. It’ll be here tomorrow, next week, and next year, 38 million strong. It’ll have all its problems and its promise. But it’s stuck with a hell of an inefficient way of running things. It makes you think that some time soon it might be a good idea to consider tearing up the rule book we have and starting from scratch.

News from the Road: Chase County, Kansas

cottonwoodfalls041409.jpg

On the recent Chicago-Berkeley peregrination, we stopped in Cottonwood Falls, Kansas. One draw is the nearby Tallgrass Prairie National Preserve, in the Kansas Flint Hills. It’s beautiful country. The town itself has a reputation as a well-preserved prairie village. It’s the county seat, and the courthouse is said to be the oldest still in use in Kansas (or west of the Mississippi, depending on who you believe). Broadway, the main street stretching north from the courthouse, is brick-paved. It is bordered by some handsome old buildings, including a hotel said to have a decent restaurant. We stopped for lunch at the Emma Chase Cafe and had burgers and fries; sweet-potato fries, in my case; never had them before.  

We picked up the local paper, the Chase County Leader-News, which ran the following story at the bottom of the front page on April 9. The story never says so–the locals must just know it–but the R3 Energy plant at the center of this incident is using chicken fat (among other things) as a raw material for biodiesel fuel. I had never thought of chicken fat that way before (a story earlier this week in the Arkansas Daily Gazette mentions that Tyson Foods, a big chicken processor, has a renewable energy group and is building a plant in Louisiana “to make high-grade biodiesel and jet fuels from Tyson-produced nonfoodgrade animal fats such as beef tallow, pork lard, chicken fat and greases.” I am way behind on my alternative energy news).

Six months before the incident, the Emporia Gazette ran a rather long article on the new biofuels plant in Cottonwood Falls. It was put up by a local family looking to get into a new business. It was a win for everyone–until the chicken fat spill.

R3 cleaning up spill

City Utility Supervisor
informs council of
chicken fat spill at R3

Jerry Schwilling
Chase County Leader-News

City Utility Supervisor Ron Lake informed the Cottonwood Falls City Council at its Monday, April 6, meeting that he had discovered a large amount of chicken fat at the city’s sewer lagoons Friday, April 3.

The chicken fat had run through the sewer line from R3 Energy to a lift station and from there onto the ground around the lift station.

Lake said when he discovered the chicken fat he asked R3’s Mike Swartz about it and Swartz said it was chicken fat that had been spilled at R3.

Swartz said Tuesday, April 7, that the spill had occurred when a truck was off-loading at the plant. The truck’s equipment, Swartz said, had malfunctioned spilling the chicken fat on the ground in the plans off-loading catchment area.

That area is designed to catch any spill and divert it either to the plant’s lagoon or the city’s lagoon. The decision was made to divert the spill to the city’s lagoon, Swartz said.

However, the lift station on the sewer line malfunctioned and the chicken fat spread on the ground around the lift station instead of going into the lagoon.

Swartz said the chicken fat was biodegradable and posed no ecological threat.

Lake told the council that he was required by the state to report the spill and to have it cleaned up.

Lake said that Swartz told him the spill had occurred on March 26. R3 did not report the spill to the city, Lake said.

Swartz said he reported the spill to two city employees the day it occurred and was told that Lake was not available.

R3, Swartz said, was having the lift station steam cleaned Tuesday, April 7, and had contracted a skid loader to pick up and dispose of the chicken fat on the ground at the city’s lagoons. He said he expected the clean up to be completed by the end of the day, Tuesday, April 7.

The council directed [city attorney?] North to send R3 a letter asking R3 to clean up the spill in the next seven days or the city would contract to have it cleaned up and bill R3.

The council also asked North to look into the creation of an ordinance to deal with any future spill.