Reprieve

Six-day precipitation forecast produced by the California-Nevada River Forecast Center. According to this, published Thursday, Sept. 15, 2022, much of the San Francisco Bay Area and Northern California will get an inch or more of rain.

So now we get to the part of the story where we’ll grasp at nearly anything as a sign of hope, or reprieve, or simple delay of the inevitable.. Last week, much of California was blasted with 110-degree temperatures, day after day after day. When you look that in the face, you ask yourself how much worse can things get and how much this corner of the world, a world where more and more people are suffering under more and more extreme conditions, will change. Then things cool down. Some areas will have high temperatures over the weekend nearly 50 degrees lower than the all-time highs registered last week. This weekend, all the weather models and their interpreters say, it’s going to rain, and rain enough that it will put a bit of a damper on (but won’t end) the fire season.

I’ll take it — just a day of rain to take the edge off the harsh, dry end of summer and our drought. I call it a reprieve, knowing that a reprieve can be just a postponement of what’s to come.

What Your Rain Gauge Says About You

The measuring tube from an official CoCoRAHS (Community Collaborative Rain, Hail and Snow Network) rain gauge. There’s nothing in it.

To answer the question implicit in the title: I really have no idea.

But your rain gauge, be it an expensive electronic home weather station variety for which you’ve shelled out many hundreds of dollars or a humble plastic tube that you read manually, will tell you one thing for sure this winter in California: It’s been much drier than normal throughout our rainy season, and it’s dry now.

So far, our backyard gauge has caught 6.83 inches of rain since last July 1 (which is the “rainfall year” that used to be the standard for the National Weather Service in California; a few years ago, the agency switched to the “water year,” which runs from Oct. 1 through Sept. 30. For what it’s worth, I recorded exactly one one-hundredth of an inch (.01 inch) from last July 1 through Sept. 30; the Berkeley normal for that three months totals .31 inch).

Where was I? Right — 6.83 inches of rain since last July 1. The Berkeley “normal” for July 1 through March 8, as calculated for the “official” Berkeley station on the University of California campus, is 21.49 inches. One way to look at that: We’re about 15 inches short of our “normal” wet season rainfall. Another way: We’ve gotten just 31.8 percent of that “normal” precipitation.

I’d love to be able to compare my numbers with that station on campus, which has been keeping records since 1893. But I can’t right now. The Department of Geography employee in charge of the weather station and sending data to the public National Centers for Environmental Information database retired sometime in the last few months, and the most recent available numbers from that station are from last September. I’m told that the later data will be forthcoming … soon.

(Much later: The grad student in charge of collecting the UC Berkeley did get back to me after this was posted. The rainfall at the campus station totaled 7.99 inches at the time this post was published.)

Since the UC Berkeley info isn’t available, I’ve checked to see what other nearby CoCoRAHS (Community Cooperative Rain, Hail and Snow Network) rain watchers have recorded and compared those to the official Downtown San Francisco record for the season.

One gauge, 1.4 miles to the northwest in Albany, has recorded 6.99 inches since July 1 (.16 inch more than my gauge); another, 1.6 miles to the southwest in South Berkeley, has measured 6.39 inches (.44 less than mine). And San Francisco’s Downtown station, which has the longest continuous rainfall record on the West Coast — going back to the summer of 1849 — has picked up all of 7.41 inches since last July 1, or 39 percent of normal.

A look at the California-Nevada River Forecast Center makes it clear that our local percentages of normal — figures in the 30 to 40 percent range — are pretty typical across our slice of Northern California:

Percentage of “normal” seasonal rainfall recorded from Oct. 1, 2020, through March 8, 2021, by way of the California-Nevada River Forecast Center.

One other observation for now, by way of Jan Null, a former National Weather Service forecast who works as a consulting meteorologist. As he noted last week, California is in its second very dry winter in a row and we have a recent historical parallel, from 2013, that we can use to measure advancing drought effects across the state:

Berkeley in January: A Foot (or More) of Rain

I can hear the rain pounding down right now, just as it has been for much of the last few days and for most of January.

Our modest electronic rain gauge shows we’ve had 4 inches of rain in the last five days and 9.5 inches since Jan. 7; that’s 9.5 inches in half a month. I am a lousy record keeper, but I know we’d had about an inch and a half or 2 inches this month before Jan. 7. So we are looking at 11 to 12 inches of rain so far this month. Which I call a lot.

The current month’s record’s from Berkeley’s “official” weather station on the Cal campus aren’t available (the most recent available through the National Climate Data Center are from November; I’ve failed over the years to figure out how to get more current numbers from the folks who monitor the station).

But to double-check my half-informed guesstimate, I asked my friend Pat, whose boyfriend Paul is a weather geek with his own home weather station, how much rain they’ve seen at their place up in the Berkeley Hills. The caveat is that their place is at an elevation of 900 feet or so and is likely to get more rain than we do here at 120 feet above sea level in the Berkeley flats.

Nonetheless, here’s Pat’s Sunday afternoon report: 13.05 inches total rainfall since Jan. 1 and 4.59 inches over the past five days.

And one other cross-check, this time from a spot that I know is significantly wetter: Tilden Park’s Vollmer Peak, at 1,905 feet the highest point in the Berkeley Hills. The state Department of Water Resources reports readings from a gauge on the peak. It shows 16.5 inches for the month so far and 4.9 over the past five days.

I’ll declare it confirmed: What people have been seeing all over Northern California and the Bay Area is true in Berkeley, as well — we’ve had a very wet January. Although … not the rainiest we’ve ever seen in these parts.

Berkeley’s official weather record goes back to 1893. According to the precipitation data maintained by the Western Regional Climate Center, Berkeley’s rainiest January occurred in 1916, when 16.54 inches were recorded at the campus station.

Because the record for that month is incomplete — five days are missing — the January 1916 record is not officially considered our rainiest January. Instead, almost-as-soggy January 1911, when 15.99 inches fell, is listed as our January maximum. Huh — one could question the logic in that.

Either of those months — January 1911 or January 1916 — would qualify as Berkeley’s rainiest month on record.

Assuming I’m correct and we’re in the 11- to 12-inch mark for January rain, this would mark Berkeley’s 14th January with 10 inches of more or rain. And it would be the rainiest since 1973, when 12.47 inches fell.

Chicago and Midwest Weather: Condition Orange

weather072512.png

My brief stay in Chicago has included a couple of Summer of 2012 heat spikes, interspersed with less radical summer weather, as a frontal boundary oscillates across this part of the Midwest. Today’s National Weather Service forecast map for the Chicago region is orange in every direction, indicating a heat advisory. Temperatures in the city are expected to hit 100. Outside the city, up to 105. (I note that the forecast high in San Francisco today is … 63.)

Tom Skilling, the dean of Chicagoland TV weather forecasters, and a meteorologist who is unfailingly informative first and entertaining second, sums up today’s torrid conditions on the WGN/Tribune Chicago Weather Center blog:

“The blisteringly hot air mass responsible for 100-degree or hotter temperatures across sections of 19 states Tuesday re-expands into the Chicago area Wednesday. It’s on track to bring Chicago its fifth triple-digit high temperature of 2012—the most official 100+degree readings here of any year since 1988.

“Temperatures surge past 90-degrees for a 34th time this year at O’Hare and 35th time at Midway—extraordinary when you consider the average since weather records began in 1871 has been only 17 such days at O’Hare and 23 at Midway!

“…This summer’s warmth has been nothing if not persistent. If you needed any additional evidence this weather pattern has been unusual, WGN weather producer Bill Snyder, in surveying the city’s official temperature records, finds Chicago is to log an unprecedented 29th consecutive day of above normal temperatures—making this the most back-to-back days to post a surplus in the 5.5 years since a Dec. 10, 2006 through Jan. 14, 2007 mild spell in which above normal temperatures were recorded over 36 consecutive days.”

High Country, Out of Character

mountdana011112.jpg

That’s Mount Dana, elevation 13,057 feet above sea level, just south of Tioga Pass in Yosemite National Park. The picture was shot from a ridge above the Gaylor Lakes just north of the pass, elevation about 10,500.

My nephew Max and I drove across the Tioga road on Wednesday, and it’s a trip that will leave an impression for some time. As I’ve said elsewhere, this is country that’s normally far beyond the reach of the casual winter traveler. The Sierra this high up is usually buried in snow. Beyond that, it can be cold and harsh in a way that’s utterly foreign to us Northern California lowlanders. The day we were up there, it felt like the temperature was in the high 40s, at least, and warmer in the sunlight. There was no wind. I was wearing shorts, though that was pushing it a little. Plenty of others have journeyed up to this strangely accessible alpine world. A local outdoors writer did a blog post last week about a couple guys who had driven up to hike Mount Dana–yeah, that peak pictured above–in running shoes.

All the weather forecasts show that this midwinter idyll, made possible by a long, long dry spell accompanied by unusually mild daytime temperatures, is coming to an end. The forecast for the end of the week is blizzardy: snow, then more snow, with high winds. And already, the weather has changed. Today’s high is for a high of about 30, with 50 mph winds gusting to 80 mph. Tonight’s forecast: a low of 10, with a westerly wind of 60-65 mph gusting to 105 mph. I have a picture in my head of being blown clear off this ridge.

More on this later. For a rather short trip–we were only on the road across the high country for a few hours–it filled my head with impressions.

Balmy New Year, with Crow

crow010112.jpg

Crow on a wire, just around the corner and up the street from us. This particular specimen was one of a pair that was taking a dim view of The Dog’s passing as we headed out on a walk late in the afternoon. And the afternoon: Clear and warm as any New Year’s Day has a right to be. The very unofficial high at our house was 68.5 degrees; the Berkeley record going back to about 1900 is 67, set in 1996 (the National Weather Service reports that at least one East Bay high temperature record was set today: it was 67 in downtown Oakland, breaking the record of 66 set in 1997).

It’s December. Do You Know Where Your Rain Is?

rainforecast120211.png

It’s December now in the Bay Area, and if you’re fastidious about your weather expectations, you look out the window and want to see rain. Or at least a little gray. But in the wake of the little wind event of the past couple of days, what I see out there is a sparkling azure sky without a hint of a cloud.

Our climate is mostly dry from sometime in April to sometime in October, mostly wet from October to April, except when it’s not. And when it’s not, we’ve got trouble. Yes, things in the cities are beautiful, and when you turn on the spigot, water from somewhere magically appears. But you know that somewhere–up in the Sierra, out in the Valley–things aren’t so good. There won’t be enough mountain snow to help replenish the reservoirs in the spring. The farmers will want water they cannot get. The fish and wildlife that depend on an abundant flow of water through the Delta, species threatened because for decades they were last in line when people thought about how to spend the water we bank, will suffer. The edge to the anxiety comes from the knowledge that drought happens here, and drought can become a social and political as well as a natural and environmental mess.

Feeling nervous yet? I am. I follow Jan Null, a Bay Area meteorologist. Here’s his climate summary for last month:

November 2011 was a cool and mostly dry month across California. Monthly average maxima anomalies were -1.0 (San Jose) to -3.6 degrees (Los Angeles), while monthly mean anomalies were -0.8 to -2.3 degrees. North of the Tehachapis rainfall was well below normal ranging from 28% of normal (Sacramento) to 69% (Eureka) while Southern California was quite wet with Los Angeles and San Diego at 152% and 309% of normal respectively.

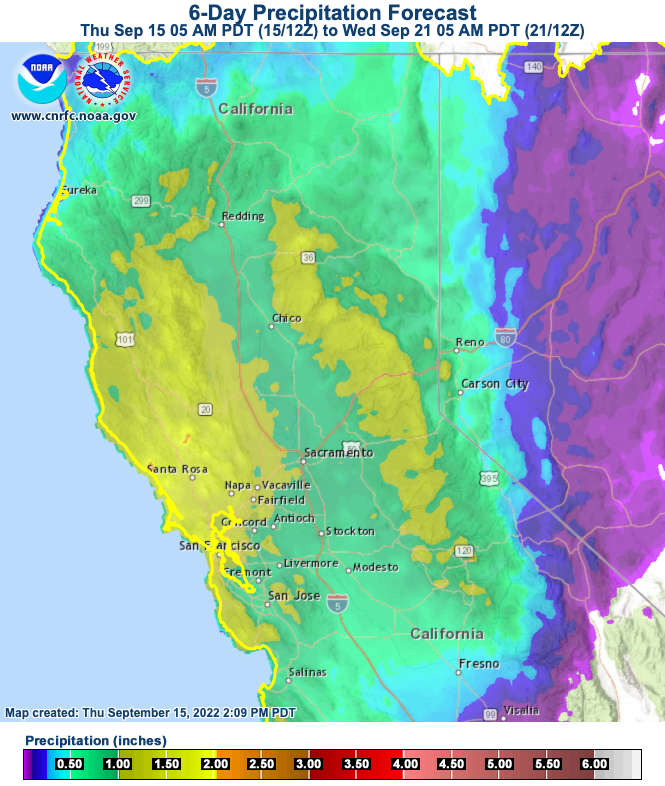
Sometimes, to reassure myself that all will soon be well, I might take a spin through weather and climate sites to see what the professionals are saying about the forecast. That image to the right is a graphic of the Quantitative Precipitation Forecast from the California Nevada River Forecast Center. During a wet period, the map will be a glorious swirl of color–blue and green and yellow, depicting progressively heavier precipitation, and sometimes orange and splashes of red and magenta when it’s really wet (there’s a scale at the top of the map; click on the image for a full-size version). Gray, on the other hand, means dry. No rain in the lowlands. No snow in the uplands. No reassurance.

Next, here’s how one of the meteorologists down in the Bay Area National Weather Service office in Monterey sums up the coming week in the Area Forecast Discussion (using familiar all-caps weather advisory style):

DRY WEATHER LOOKS TO BE IN STORE FOR THE DISTRICT SUNDAY THOUGH NEXT WEEK. HOWEVER…THE MODELS ARE STARTING TO SHOW SOME DIFFERENCES. THE ECMWF KEEPS A STRONG RIDGE ALONG 135W STRETCHING INTO THE GULF OF ALASKA WITH A STRONG SHORTWAVE DIVING DOWN THROUGH THE GREAT BASIN LATE THURSDAY INTO FRIDAY. THIS SCENARIO WOULD BRING ANOTHER BOUT OF GUSTY OFFSHORE WINDS. THE GFS WEAKENS AND FLATTENS THE RIDGE BY THE END OF NEXT WEEK…WITH A SHORTWAVE MOVING INTO THE NORTHERN PLAINS NOT DIVING SHARPLY SOUTHEAST. THIS WOULD NOT BE A WINDY SCENARIO FOR THE DISTRICT. REGARDLESS OF THE MODEL…DRY WEATHER IS IN STORE THROUGH THE END OF THE NEXT WORKWEEK.

Got that? The major question the weather persons are dealing with is whether or not the forecast models indicate another windstorm for the coming week. Chances of rain–none apparent.

The pluviophile now turns eyes to the coming month, even though we’re exiting the realm of forecasting and prediction and entering into one of probabilities and outlooks. But here goes: The National Weather Service Climate Prediction Center says the Bay Area should have “near median” precipitation in the period from eight to 14 days from now (median in this case meaning rainfall along the lines of the “middle 10 years” of the past three decades in terms of rainfall); the northern quarter of California is looking at below-median rainfall during that period. The center’s one-month outlook shows equal chances of above, below, or near median precipitation. That’s because “there were no strong and consistent climate signals” among the forecast models.

And one last stop: Both the most recent U.S. Drought Monitor report and the seasonal outlook, through the end of February, show California drought-free (things look scary in Texas, though).

So where’s the rain? Like that TV show used to say: Out there. Somewhere.

Heat Blog: Hot in Chicago

When we were in Chicago a few weeks ago, it was hot and humid virtually the entire week or so we were here. Temperatures up to the mid-90s and some real sweaty 80 to 90 percent humidity days that persisted after the heat eased a bit. At the tail end of our stay, the weather broke and highs fell into the 70s. I’m told they stayed that way until my return today, when the high downtown hit 97. Right now, it’s getting close to 1 a.m. in Chicago. The temperature: 86 degrees at O’Hare, 87 at Midway. That’s extraordinary for the middle of the night. Tomorrow’s forecast: the upper 90s again.

(Yes: I’m aware that people in Texas and the southern Plains have been going through about three months of this without a break. And yes: I enjoy our effete fog-bank summers in the Bay Area, which sometimes seem cool enough to keep your viognier nicely chilled without benefit of a fridge.)

Chicago meteorologist Tom Skilling breaks down the late-season heat wave in a post on the Chicago Weather Center super-blog:

The heat is on;Chicago is headed into the hottest opening two days of any September in 58 years!

(That exclamation point lends a certain “War of the Worlds” air to the proceedings, I think. And 58 years seems like ancient history, harking back to the days of Demosthenes or Davy Crockett. But then I remembered my mom was about two months and counting into her pregnancy with your humble blogger.)

Tom says:

It’s not at all “typical” to see temperatures here this late in the season as hot as those being predicted over the next few days. Highs are to reach 94-degrees Thursday and 98-degrees Friday. A few of Friday’s hottest temperatures could reach or exceed 100-degrees.

Back-to-back 90-degree or higher temperatures last occurred on September’s two opening days three years ago in 2008. But you have to go back 58 years—to 1953—-to find readings on September 1 and 2 warmer than those in coming days. That’s the year September opened with two 101-degree highs on the 1st and 2nd.

Air-Road Blog: Chicago

chicago080111.jpg

We flew to Chicago yesterday. It was clear and warm as we left Oakland. We landed in Salt Lake City just as a big monsoon-driven cell passed over the area. And in Chicago, we emerged into a steam bath. It was about nearly 1 in the morning and about 80 degrees. My first impression was 80 sopping-wet degrees, but I think you get used to it. I say “I think” because like millions of others in Chicagoland, I’m living Monday morning in air-conditioned comfort as the temperature outside climbs toward the 90s (and there’s a complicating factor today: the National Weather Service has issued an air-quality alert for high pollution levels today).

In other weather talk: A neighbor mentioned she’d heard that Chicago had had more than 6 inches of rain in a day recently, but thought that might have been a typo. Well, no, it wasn’t. As the Chicago Weather Center site reports in detail, July 2011 was one of the driest Chicago Julys on record–until 10 days ago. Then storms began rolling in, including one that dropped 6.86 inches on July 23 (the most on one date in the city going back to 1870), and the month turned into the city’s rainiest July on record). Here’s the rundown from WGN’s Tom Skilling and company:

From one of driest to all-time wettest July in just six days

Wettest July also third-warmest

Chicago’s 24-hour rainfall record …

(And the picture? That’s Lunt Avenue, in front of my sister’s place in West Rogers Park. God’s Battle Axe? Well, it gets your attention. The church describes itself as “a fast growing charismatic prayer ministry … destroying the works of darkness thereby impacting the world.” The ministry’s leader “is referred to by some of his close friends as ‘a Praying Machine: The Anointed Apostle of Prayers.’ “)