Reprieve

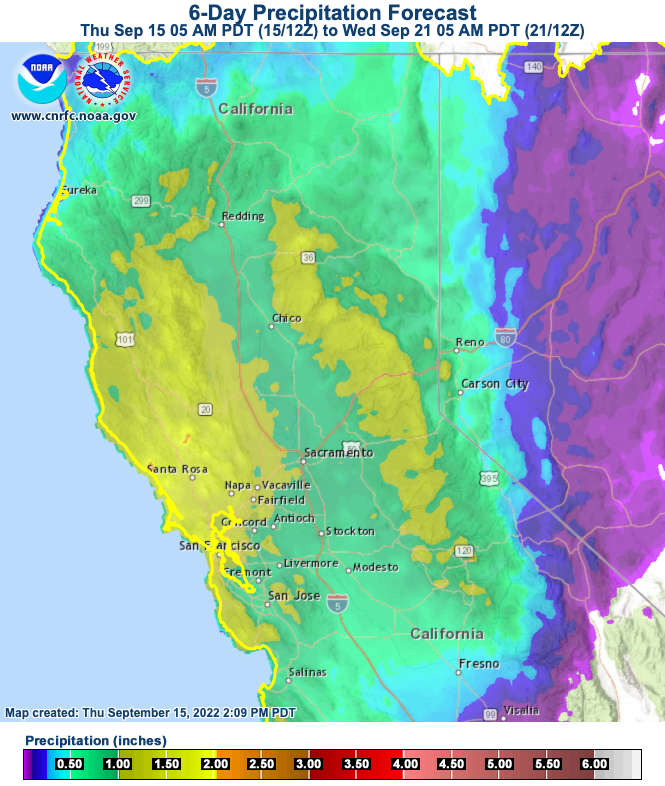
Six-day precipitation forecast produced by the California-Nevada River Forecast Center. According to this, published Thursday, Sept. 15, 2022, much of the San Francisco Bay Area and Northern California will get an inch or more of rain.

So now we get to the part of the story where we’ll grasp at nearly anything as a sign of hope, or reprieve, or simple delay of the inevitable.. Last week, much of California was blasted with 110-degree temperatures, day after day after day. When you look that in the face, you ask yourself how much worse can things get and how much this corner of the world, a world where more and more people are suffering under more and more extreme conditions, will change. Then things cool down. Some areas will have high temperatures over the weekend nearly 50 degrees lower than the all-time highs registered last week. This weekend, all the weather models and their interpreters say, it’s going to rain, and rain enough that it will put a bit of a damper on (but won’t end) the fire season.

I’ll take it — just a day of rain to take the edge off the harsh, dry end of summer and our drought. I call it a reprieve, knowing that a reprieve can be just a postponement of what’s to come.

Dry December Update

“Rain, rain, rain, rain,
Why’d you cause me so much pain?”
—”The Rains Came,” Sir Douglas Quintet

Southern California got a little spritz of rain over the weekend—nearly a fifth of an inch yesterday in the desert town of Blythe. Here, it’s dry, and the California-Nevada River Forecast Center sees only a small chance that rain will fall over the northern part of the state in the next week (and that will be far north of the Bay Area). Our local National Weather Service forecast office, in Monterey, reads the models the same way: “Dry and mild weather will continue through at least the next 7 days … with little variation in the upper level weather pattern. A series of storm systems will move towards the region over the next week … but pass to the north and east of the area. ” The longer-range outlook from NOAA’s Climate Prediction Center is for drier and warmer than median weather.

Here’s the local NWS table on precipitation so far this year. And below that, today’s theme song

Station July 1-Dec. 18, 2011 % of Normal July 1-Dec. 18, 2010 % of Normal July 1-Dec. 18 Normal July 1-June 30 Normal
SFO Int’l Airport 2.87 50 5.76 101 5.69 20.11
Oakland Airport 3.06 52 6.66 113 5.91 17.42
Mountain View Airport 1.73 45 3.24 85 3.83 13.35
San Jose Airport 1.53 39 3.05 77 3.95 15.08
Santa Rosa Airport 4.45 42 13.19 123 10.70 31.91
Salinas Airport 3.31 103 3.45 107 3.21 12.91
San Francisco Downtown 3.35 47 7.88 111 7.08 22.28

It’s December. Do You Know Where Your Rain Is?

rainforecast120211.png

It’s December now in the Bay Area, and if you’re fastidious about your weather expectations, you look out the window and want to see rain. Or at least a little gray. But in the wake of the little wind event of the past couple of days, what I see out there is a sparkling azure sky without a hint of a cloud.

Our climate is mostly dry from sometime in April to sometime in October, mostly wet from October to April, except when it’s not. And when it’s not, we’ve got trouble. Yes, things in the cities are beautiful, and when you turn on the spigot, water from somewhere magically appears. But you know that somewhere–up in the Sierra, out in the Valley–things aren’t so good. There won’t be enough mountain snow to help replenish the reservoirs in the spring. The farmers will want water they cannot get. The fish and wildlife that depend on an abundant flow of water through the Delta, species threatened because for decades they were last in line when people thought about how to spend the water we bank, will suffer. The edge to the anxiety comes from the knowledge that drought happens here, and drought can become a social and political as well as a natural and environmental mess.

Feeling nervous yet? I am. I follow Jan Null, a Bay Area meteorologist. Here’s his climate summary for last month:

November 2011 was a cool and mostly dry month across California. Monthly average maxima anomalies were -1.0 (San Jose) to -3.6 degrees (Los Angeles), while monthly mean anomalies were -0.8 to -2.3 degrees. North of the Tehachapis rainfall was well below normal ranging from 28% of normal (Sacramento) to 69% (Eureka) while Southern California was quite wet with Los Angeles and San Diego at 152% and 309% of normal respectively.

Sometimes, to reassure myself that all will soon be well, I might take a spin through weather and climate sites to see what the professionals are saying about the forecast. That image to the right is a graphic of the Quantitative Precipitation Forecast from the California Nevada River Forecast Center. During a wet period, the map will be a glorious swirl of color–blue and green and yellow, depicting progressively heavier precipitation, and sometimes orange and splashes of red and magenta when it’s really wet (there’s a scale at the top of the map; click on the image for a full-size version). Gray, on the other hand, means dry. No rain in the lowlands. No snow in the uplands. No reassurance.

Next, here’s how one of the meteorologists down in the Bay Area National Weather Service office in Monterey sums up the coming week in the Area Forecast Discussion (using familiar all-caps weather advisory style):

DRY WEATHER LOOKS TO BE IN STORE FOR THE DISTRICT SUNDAY THOUGH NEXT WEEK. HOWEVER…THE MODELS ARE STARTING TO SHOW SOME DIFFERENCES. THE ECMWF KEEPS A STRONG RIDGE ALONG 135W STRETCHING INTO THE GULF OF ALASKA WITH A STRONG SHORTWAVE DIVING DOWN THROUGH THE GREAT BASIN LATE THURSDAY INTO FRIDAY. THIS SCENARIO WOULD BRING ANOTHER BOUT OF GUSTY OFFSHORE WINDS. THE GFS WEAKENS AND FLATTENS THE RIDGE BY THE END OF NEXT WEEK…WITH A SHORTWAVE MOVING INTO THE NORTHERN PLAINS NOT DIVING SHARPLY SOUTHEAST. THIS WOULD NOT BE A WINDY SCENARIO FOR THE DISTRICT. REGARDLESS OF THE MODEL…DRY WEATHER IS IN STORE THROUGH THE END OF THE NEXT WORKWEEK.

Got that? The major question the weather persons are dealing with is whether or not the forecast models indicate another windstorm for the coming week. Chances of rain–none apparent.

The pluviophile now turns eyes to the coming month, even though we’re exiting the realm of forecasting and prediction and entering into one of probabilities and outlooks. But here goes: The National Weather Service Climate Prediction Center says the Bay Area should have “near median” precipitation in the period from eight to 14 days from now (median in this case meaning rainfall along the lines of the “middle 10 years” of the past three decades in terms of rainfall); the northern quarter of California is looking at below-median rainfall during that period. The center’s one-month outlook shows equal chances of above, below, or near median precipitation. That’s because “there were no strong and consistent climate signals” among the forecast models.

And one last stop: Both the most recent U.S. Drought Monitor report and the seasonal outlook, through the end of February, show California drought-free (things look scary in Texas, though).

So where’s the rain? Like that TV show used to say: Out there. Somewhere.

Bay Area August: Departures from Normal

Saturday and Sunday were actually sunny here, for the most part. Off to the west Sunday night, Venus was visible well after dark–the first time I’ve seen that in weeks. Not that this signals a break in our marathon summer fogfest. The forecast for the next week calls for more of what we’ve been having for weeks along the coast: cool, mostly gray days that might give way to an hour or two of honest sunshine. Highs in the low to mid 60s. (This is not a complaint. Our air-conditioning bills here: zero.)

The map below is something that my friend Pete pointed me to a couple weeks ago. It’s from the Western Regional Climate Center and is a quick take on how much our daily high temperatures have departed from normal. There’s a tiny wedge just north of San Francisco–Point Reyes–where daily maximums have been more than 10 degrees lower than average. Here in Berkeley, highs have been 6 to 8 degrees below normal, and that’s pretty much the story for most of the rest of region. temperatures.gif

California Water: Is the Drought Over?

Is California’s drought over? OK, let me take a step back. Yes, I realize one could debate whether the last three years in California actually constitute a drought. But that’s a discussion for another time. For now, I think everyone can agree that we’ve had lower-than-average precipitation for the past three years.

The only reason to ask the question is that, after the first half of the wet season delivered only spotty rain, we’ve had a pretty solid week of downpours. Water is sluicing into our reservoirs, and the hills are greening up. All of that is a sign of what we think winter should be here. ( My favorite water statistic of the week: when the storms were at their heaviest around Lake Shasta, California’s biggest reservoir, water was flowing into the lake at about 500,000 gallons per second. That’s 1.5 acre feet, or about enough for three “average” households for a year, every second.*)

Amazing numbers like that aside, the people who get paid to think about whether the drought is over say “not yet.” The San Jose Mercury News published a good summary of the situation a couple days ago: “It’s soaking. But the drought’s not over just yet.”

That story does contain one bit of typically odd California thinking about rain and water, though. It quotes a very knowledgeable local meteorologist, Jan Null, about where we stand in terms of normal rainfall. He says: “”We need February and March to be wetter than January to really end the drought. You have to look at the long game here. This is a great start, but we need to keep it going.”

The last sentence stopped me: “This is a great start, but we need to keep it going.”

Of course, Mr. Null recognizes better than most that the amount of rain we get and when we get it is out of anyone’s control. Still, “we’ve got to keep it going.” Maybe he’s a professional rainmaker.

Once you understand the importance of water in California, once you get how crucial the winter rains are, there’s a score-keeping aspect to weather-watching here. It becomes second nature to study the rain gauge and the seasonal precipitation table as an index of performance, a reflection on whether a great collective goal is being attained. Lots of rain means we’re doing well (and that we can put the complexities of water supply out of our minds). A dry spell means we’re failing (and that there will be hell to pay, or at least the strong possibility of stringent conservation measures).

But in reality, there’s no performance going on. The rain is the rain, and the climate is the climate. California’s rainfall is famously variable. Dry spells can be counted on, and the current run of dry years is the third we’ve had since I arrived in Berkeley in the ’70s. My first California winter, 1976-’77, was bone dry and was in fact the second year of the driest two-year period ever recorded here. A decade later, from roughly 1986 through 1992, we had another run of dry years. And if our winter rains were to stop now, we’d be in the fourth year of drier-than-normal years. In between these periods we’ve had average years and very wet years and years that didn’t quite hit the average. That might not be too different from anywhere else. The reason it’s a bigger deal here than it might be in, say, central Wisconsin, is that we have a six-month dry season, we need to store water to get through that, and we have 37 million people and millions and millions acres of farmland that need water whether it’s falling from the sky or not. Thus the need to believe we can wish the rain to keep going during the wet season and the tendency to feel disappointment when the winter turns into a string of dry, sunny days.

*500,000 gallons per second. Here’s the arithmetic: California Department of Water Resources figures (here: http://bit.ly/6HzIuu) show that in the hour between noon and 1 p.m. on Tuesday, January 19, the net inflow into the lake was 66,288 cubic feet per second. That’s the highest inflow figure for any single hour all week. One cubic foot equals 7.48 gallons. 66,288*7.48=495,834.24 gallons. One acre foot=325,851 gallons. And 495,834.24/325,851=1.52 acre feet. Per second. For the entire 24 hours of the 19th, Lake Shasta’s inflow averaged just over 1 acre foot a second.

Bonus feature! KQED’s latest California Reservoir Watch map, updated earlier today:


View KQED: California Reservoir Watch in a larger map