Portrait of a Drought: Folsom Lake

folsom010414.jpg

If you live in California, you’ve been hearing about how dry it is here. Our previous rainy season stopped abruptly just before New Year’s Day 2013. The rains didn’t return this fall, meaning many sites in the state had their lowest recorded precipitation ever. San Francisco, with records dating back to 1849, was one of those places; just 5.59 inches of rain fell during 2013. (The next-lowest total was 8.73 inches, recorded during the severe drought of 1976-77.) San Francisco’s average seasonal rainfall — dated from July 1 through June 30 to take account of the wet season — is about 21 inches. The highest rain total ever: the epic winter of 1861-62, which almost drowned Sacramento: 49.27 inches.

About the wet and dry seasons: Supposing we ever have a “typical” year, storms start arriving from the Pacific in October and keep rolling in through April. Normally, we’ll get breaks between waves of storms that bring lowland rains and huge amounts of snowfall to the Sierra Nevada. Since the state needs water year-round, since so much of it arrives in the form of snow that runs off from the mountains when the weather warms up, since there’s no way of knowing from one year to the next how much rain and snow we’ll get, we live on stored water. We have lots and lots of reservoirs.

And one reservoir that’s getting lots of attention during the current drought is Folsom Lake, on the American River northeast of Sacramento. As California reservoirs go, it’s not one of the biggest — in fact I think it ranks as the tenth largest in storage capacity, with 977,000 acre feet (if you buy the definition that an acre foot can supply about two U.S. households for a year, that’s enough water for roughly 5 million people for a year). The water in the lake is used to generate electricity, for drinking water, and for downstream farms. It’s also supposed to provide flood protection and “recreational opportunities” — swimming, boating, fishing, all those things you can do in a lake that’s in the middle of the hot, dry Sierra foothills.

Right now, Folsom lake is down to about 180,000 acre feet, about 18 percent of capacity. That’s just the sixth time since the reservoir was filled in 1955-56 that the level has fallen below 200,000 acre feet, and it appears to be the lowest the lake has ever been in January, right in the middle of what’s supposed to be the rainy season. And when I say low, I mean low. At capacity, the lake’s surface is 466 feet above sea level; yesterday, the lake level fell below 362 feet.

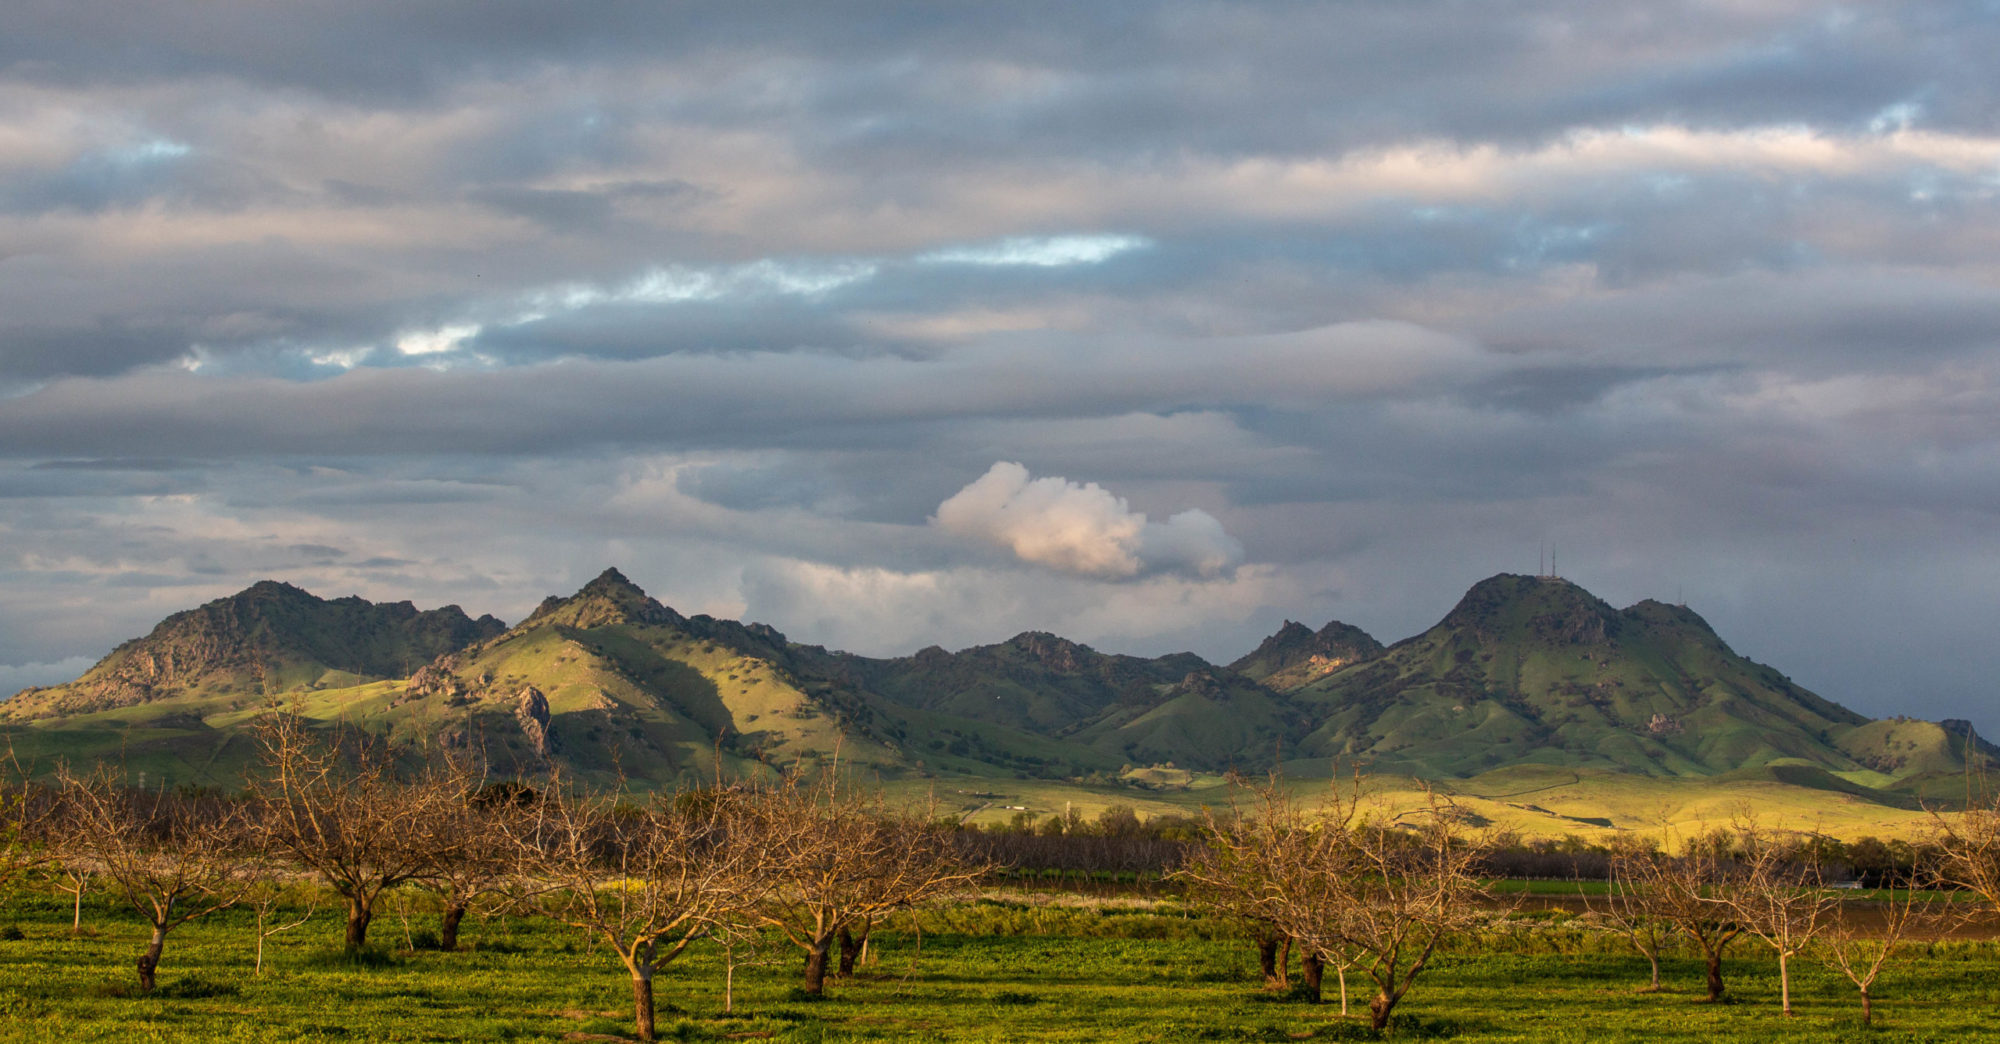
I drove up yesterday to take a look at the lake, the sand, the rocks, the mud, and the little bit of water that’s still spread out in the lake’s deeper channels. The weather was beautiful. People were out sight-seeing, riding bikes, meditating, even fishing, though one guy told me that when he cast his lures out into the water, they were hitting the bottom. It was pretty hard to imagine that all this was going on 104 feet below the surface of the full reservoir would be. We’ll see how low it goes. Right now, there aren’t any real storms on the horizon.

Here’s the slideshow from yesterday’s trip:

It’s December. Do You Know Where Your Rain Is?

rainforecast120211.png

It’s December now in the Bay Area, and if you’re fastidious about your weather expectations, you look out the window and want to see rain. Or at least a little gray. But in the wake of the little wind event of the past couple of days, what I see out there is a sparkling azure sky without a hint of a cloud.

Our climate is mostly dry from sometime in April to sometime in October, mostly wet from October to April, except when it’s not. And when it’s not, we’ve got trouble. Yes, things in the cities are beautiful, and when you turn on the spigot, water from somewhere magically appears. But you know that somewhere–up in the Sierra, out in the Valley–things aren’t so good. There won’t be enough mountain snow to help replenish the reservoirs in the spring. The farmers will want water they cannot get. The fish and wildlife that depend on an abundant flow of water through the Delta, species threatened because for decades they were last in line when people thought about how to spend the water we bank, will suffer. The edge to the anxiety comes from the knowledge that drought happens here, and drought can become a social and political as well as a natural and environmental mess.

Feeling nervous yet? I am. I follow Jan Null, a Bay Area meteorologist. Here’s his climate summary for last month:

November 2011 was a cool and mostly dry month across California. Monthly average maxima anomalies were -1.0 (San Jose) to -3.6 degrees (Los Angeles), while monthly mean anomalies were -0.8 to -2.3 degrees. North of the Tehachapis rainfall was well below normal ranging from 28% of normal (Sacramento) to 69% (Eureka) while Southern California was quite wet with Los Angeles and San Diego at 152% and 309% of normal respectively.

Sometimes, to reassure myself that all will soon be well, I might take a spin through weather and climate sites to see what the professionals are saying about the forecast. That image to the right is a graphic of the Quantitative Precipitation Forecast from the California Nevada River Forecast Center. During a wet period, the map will be a glorious swirl of color–blue and green and yellow, depicting progressively heavier precipitation, and sometimes orange and splashes of red and magenta when it’s really wet (there’s a scale at the top of the map; click on the image for a full-size version). Gray, on the other hand, means dry. No rain in the lowlands. No snow in the uplands. No reassurance.

Next, here’s how one of the meteorologists down in the Bay Area National Weather Service office in Monterey sums up the coming week in the Area Forecast Discussion (using familiar all-caps weather advisory style):

DRY WEATHER LOOKS TO BE IN STORE FOR THE DISTRICT SUNDAY THOUGH NEXT WEEK. HOWEVER…THE MODELS ARE STARTING TO SHOW SOME DIFFERENCES. THE ECMWF KEEPS A STRONG RIDGE ALONG 135W STRETCHING INTO THE GULF OF ALASKA WITH A STRONG SHORTWAVE DIVING DOWN THROUGH THE GREAT BASIN LATE THURSDAY INTO FRIDAY. THIS SCENARIO WOULD BRING ANOTHER BOUT OF GUSTY OFFSHORE WINDS. THE GFS WEAKENS AND FLATTENS THE RIDGE BY THE END OF NEXT WEEK…WITH A SHORTWAVE MOVING INTO THE NORTHERN PLAINS NOT DIVING SHARPLY SOUTHEAST. THIS WOULD NOT BE A WINDY SCENARIO FOR THE DISTRICT. REGARDLESS OF THE MODEL…DRY WEATHER IS IN STORE THROUGH THE END OF THE NEXT WORKWEEK.

Got that? The major question the weather persons are dealing with is whether or not the forecast models indicate another windstorm for the coming week. Chances of rain–none apparent.

The pluviophile now turns eyes to the coming month, even though we’re exiting the realm of forecasting and prediction and entering into one of probabilities and outlooks. But here goes: The National Weather Service Climate Prediction Center says the Bay Area should have “near median” precipitation in the period from eight to 14 days from now (median in this case meaning rainfall along the lines of the “middle 10 years” of the past three decades in terms of rainfall); the northern quarter of California is looking at below-median rainfall during that period. The center’s one-month outlook shows equal chances of above, below, or near median precipitation. That’s because “there were no strong and consistent climate signals” among the forecast models.

And one last stop: Both the most recent U.S. Drought Monitor report and the seasonal outlook, through the end of February, show California drought-free (things look scary in Texas, though).

So where’s the rain? Like that TV show used to say: Out there. Somewhere.

Watching Water

I’ve become preoccupied the last two or three months with the level of water in California’s reservoirs. If you’re inclined to, here’s where you can join in the fun: The state Department of Water Resources’ California Data Exchange Center. The cliche to describe a collection of information like this is “treasure trove.” For example, here’s one report that I’ve taken to taking a look at just about every morning: The Sacramento/San Joaquin Daily Reservoir Storage Summary. It’s a quick look at about three dozen state’s biggest storage facilities: how much water they’re holding, how many acre feet have flowed in or out in the past day, and–especially interesting–how much water they hold compared both to the average for this date and to the amount held a year ago.

There’s a story in the numbers, though I’m still puzzling out what it is. For instance, the state’s current drought is not a drought everywhere. Although rainfall and the mountain snowpack are generally below average, some reservoirs hold more than average for this time of year and much more than they did a year ago (which was an even worse year, precipitation-wise). But the numbers are just one dimension of a complicated picture. All that water has a lot of work to do. We count on it not just for irrigating the Central Valley farms and bringing drinking and lawn water to the citiies and suburbs, but for providing electricity, too. And in recent decades, the state and federal water managers have even been made conscious of another function the water might perform: preserving wildlife–especially the once-magnificent salmon runs in the Sacramento and San Joaquin watersheds.